University Demographics
At Capitol Technology University, we believe in equity of education for all students.
Racial and Ethnic Demographics
Over 48% of our undergraduate population is represented by persons of color, and 66% is from underrepresented student populations.
Over 50% of our graduate population is represented by persons of color.
Over 57% of our doctorate population is represented by persons of color.
|
Representation |
Rights |
Resources |
|
Capitol Tech students and staff represent a diverse community of learners, scholars, and innovators. Our faculty are industry experts who foster global perspective in their programs. |
Every student has the right to a quality education, to feel supported, accepted, and free to learn without limitations or biases, and Capitol Tech recognizes the diverse needs of its student body. |
Capitol Tech has the resources needed to ensure students have access to a quality education in line with the principles of diversity, equity, and inclusion. |
Racial and Ethnic Demographics
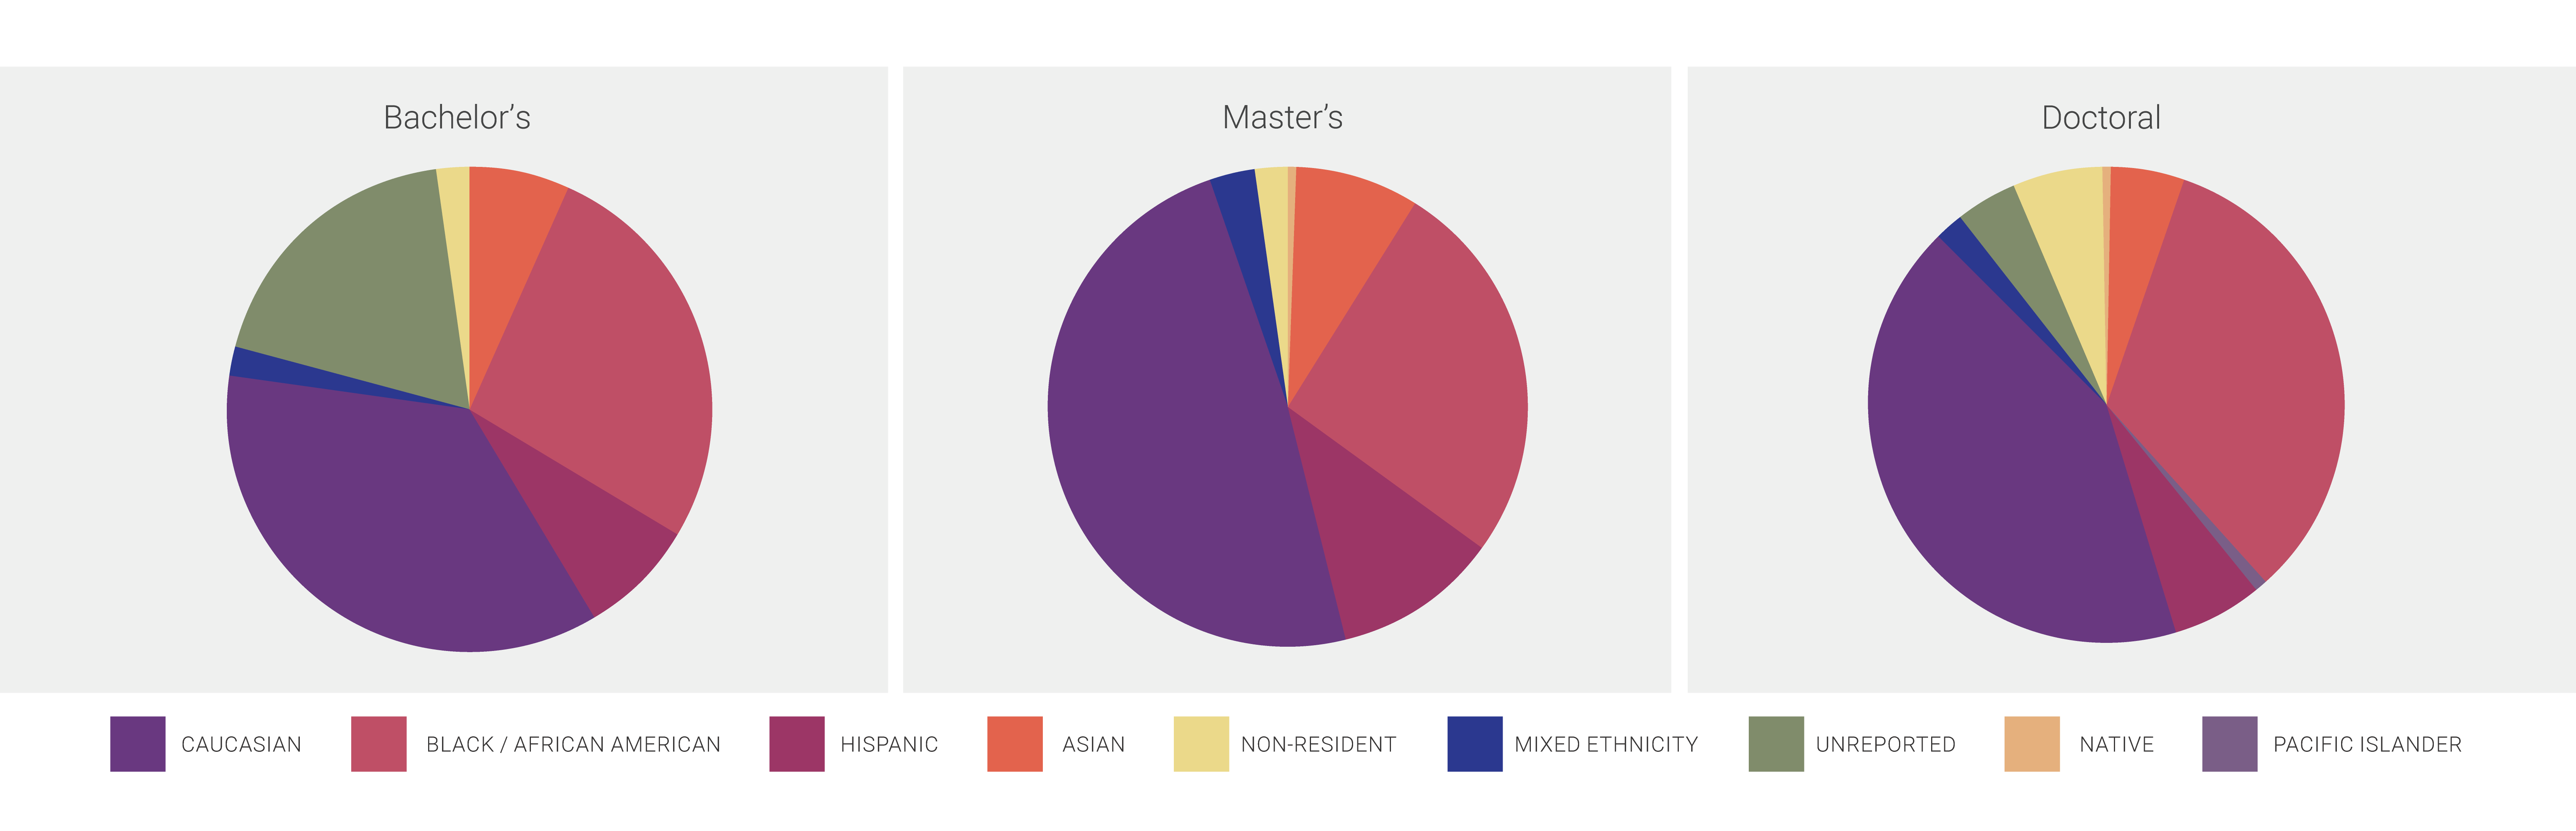
Fall 2022 Undergraduates
American Indian/Alaskan Native 0%
Asian 6.7%
Black/African American 23%
Hispanics of any Race 5%
Native Hawaiian/Pacific Islander 0%
Non-resident Alien 1.3%
Unknown/Unreported 32.4%
Two or More Races 3%
White 28.42%
Fall 2022 Master's
American Indian/Alaskan Native 0.8%
Asian 2.4%
Black/African American 22%
Hispanics of any Race 4.9%
Native Hawaiian/Pacific Islander 0.8%
Non-resident Alien 1.6%
Unknown/Unreported 32.5%
Two or More Races 1.6%
White 33.3%
Fall 2022 Doctoral
American Indian/Alaskan Native 0%
Asian 5%
Black/African American 20.9%
Hispanics of any Race 3.9%
Native Hawaiian/Pacific Islander 0.5%
Non-resident Alien 3.4%
Unknown/Unreported 38.1%
Two or More Races 0.7%
White 27.4%
Capitol Technology University strives to make our website accessible. We are committed to diversity, inclusion, and meeting the needs of all of our students, including those with disabilities. We are continually improving the accessibility of our website to conform with Guidance from the United States Department of Justice, including existing technical standards such as WCAG 2.1 Levels A and AA. Further accessibility efforts are under way and we continue to update our website to improve accessibility. In the meantime, if the format of any material on our web pages interferes with your ability to access the information, please contact Olivia Bathersfield to request assistance or if you have questions or comments about our web site’s accessibility. Please e-mail marketing@captechu.edu .