Orbiting the Unknown │ ALPHA Teaser Series #2
February 11, 2022
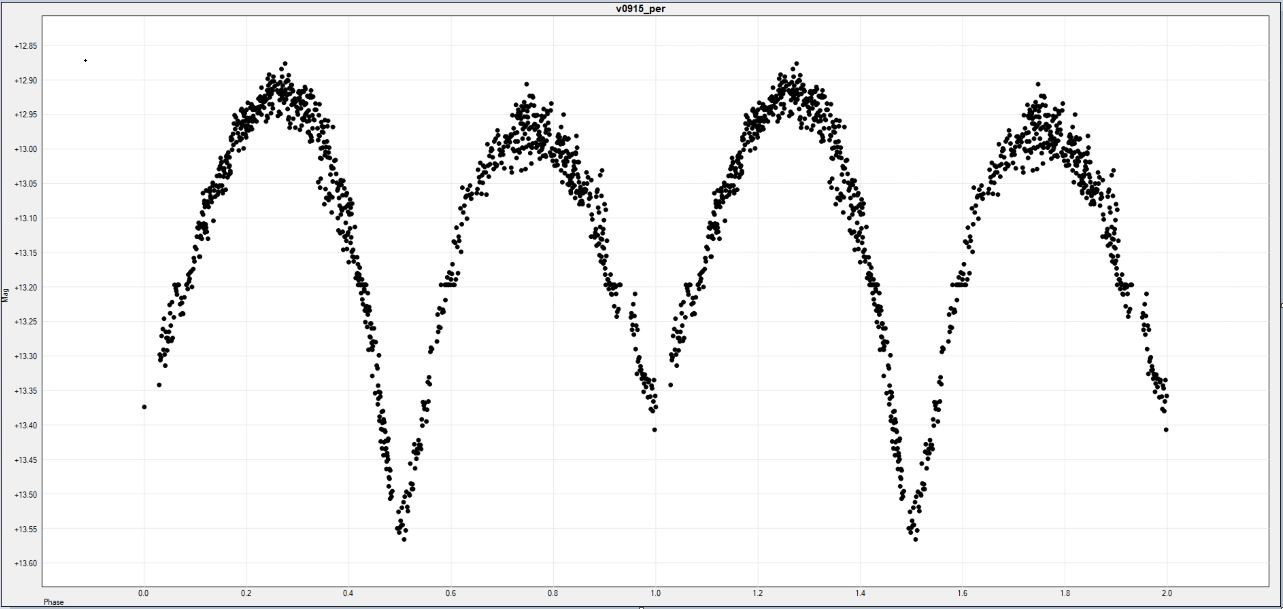
While we await the arrival of Capitol Tech’s new ALPHA Observatory, we would like to share another example of the type of data that high-powered telescopes can produce. The above image shows output captured and evaluated by Capitol Tech Astronautical Engineering student and designated ALPHA intern, Ainsley Fitzhugh. Ainsley was selected as the head intern to work with ALPHA, and in preparation, is learning more about translating the type of data that ALPHA will produce. Ainsley was able to successfully compute the orbital period of a paired star known as the eclipsing variable star V0915_Per. These two stars orbit each other and once every 6.5 hours they eclipse, resulting in a drop in brightness visible to the eye. In the graph above, a large drop in magnitude can be seen from the primary star passing in front of the secondary star, and the smaller drop is seen from the secondary star passing in front of the primary. This graph is called a “phase diagram” graph, where the x-axis indicates star brightness (magnitude) and y-axis indicates phase. This is an example of what is known as a “contact binary star system,” or a system with two stars so close together that they either touch or share gaseous envelopes. This data was also retrieved using the telescope of Astronautical Engineering Professor Marcel Mabson, similarly to the image of comet C/2019 L3 ATLAS captured last month. The ALPHA observatory will be able to produce images like these and generate data on near-earth objects (NEOs) of interest such as comets and asteroids.
We will continue to share more information about the preparations being made for the arrival of ALPHA. Stay in the loop by following our blog and social media!
Written by Erica Decker


